Part 2: How to Measure Your GPU Utilization

Debo Ray
Co-Founder, CEO

This is a 5 part series on why GPU clusters are under-utilized, how to measure utilization and how to improve it.
Part 1 - Why is your GPU cluster idle
Part 2 - How to measure your GPU utilization
Part 3 - How to fix your GPU utilization
Part 4 - GPU security and Isolation
Part 5 - Tips for optimizing GPU utilization in Kubernetes
How to measure your GPU utilization#
Traditional GPU monitoring approaches, such as nvidia-smi, provide point-in-time utilization snapshots but fail to capture the strategic insights needed for optimization. Effective GPU utilization monitoring requires a multidimensional approach that integrates with Kubernetes orchestration and provides workload-specific insights.
DCGM Integration with Kubernetes#
The NVIDIA Data Center GPU Manager (DCGM) provides the foundation for comprehensive GPU monitoring in Kubernetes environments. When integrated with cAdvisor and Kubernetes metrics, DCGM enables cluster-wide visibility into GPU utilization patterns across different workload types.
The NVIDIA GPU Operator simplifies DCGM deployment and management in Kubernetes clusters, providing automated installation and configuration of GPU monitoring components. This operator-based approach ensures consistent monitoring across nodes while integrating with existing Kubernetes observability infrastructure.
Key metrics for strategic GPU monitoring include:
- GPU utilization percentage: Actual compute utilization vs. allocated capacity
- Memory utilization: GPU memory usage vs. available GPU memory
- Tensor throughput: The rate of useful computational work being performed
- Request-level tracking: Whether GPUs are receiving active inference requests or sitting idle
Multi-Dimensional Utilization Analysis#
Effective GPU optimization requires understanding the relationship between different utilization dimensions. A GPU might show 90% memory utilization while achieving only 30% compute utilization, indicating potential for resource sharing or workload optimization.
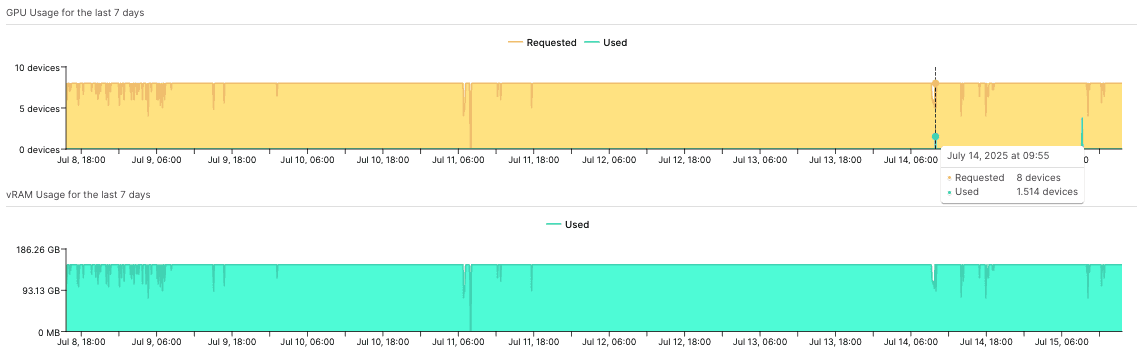
While loading a model into GPU memory makes it consume VRAM, investigating the GPU utilization shows that the workload is never interacted with - workloads like these can be safely scaled down to 1 or 2 replicas (where each replica uses 1 GPU device).
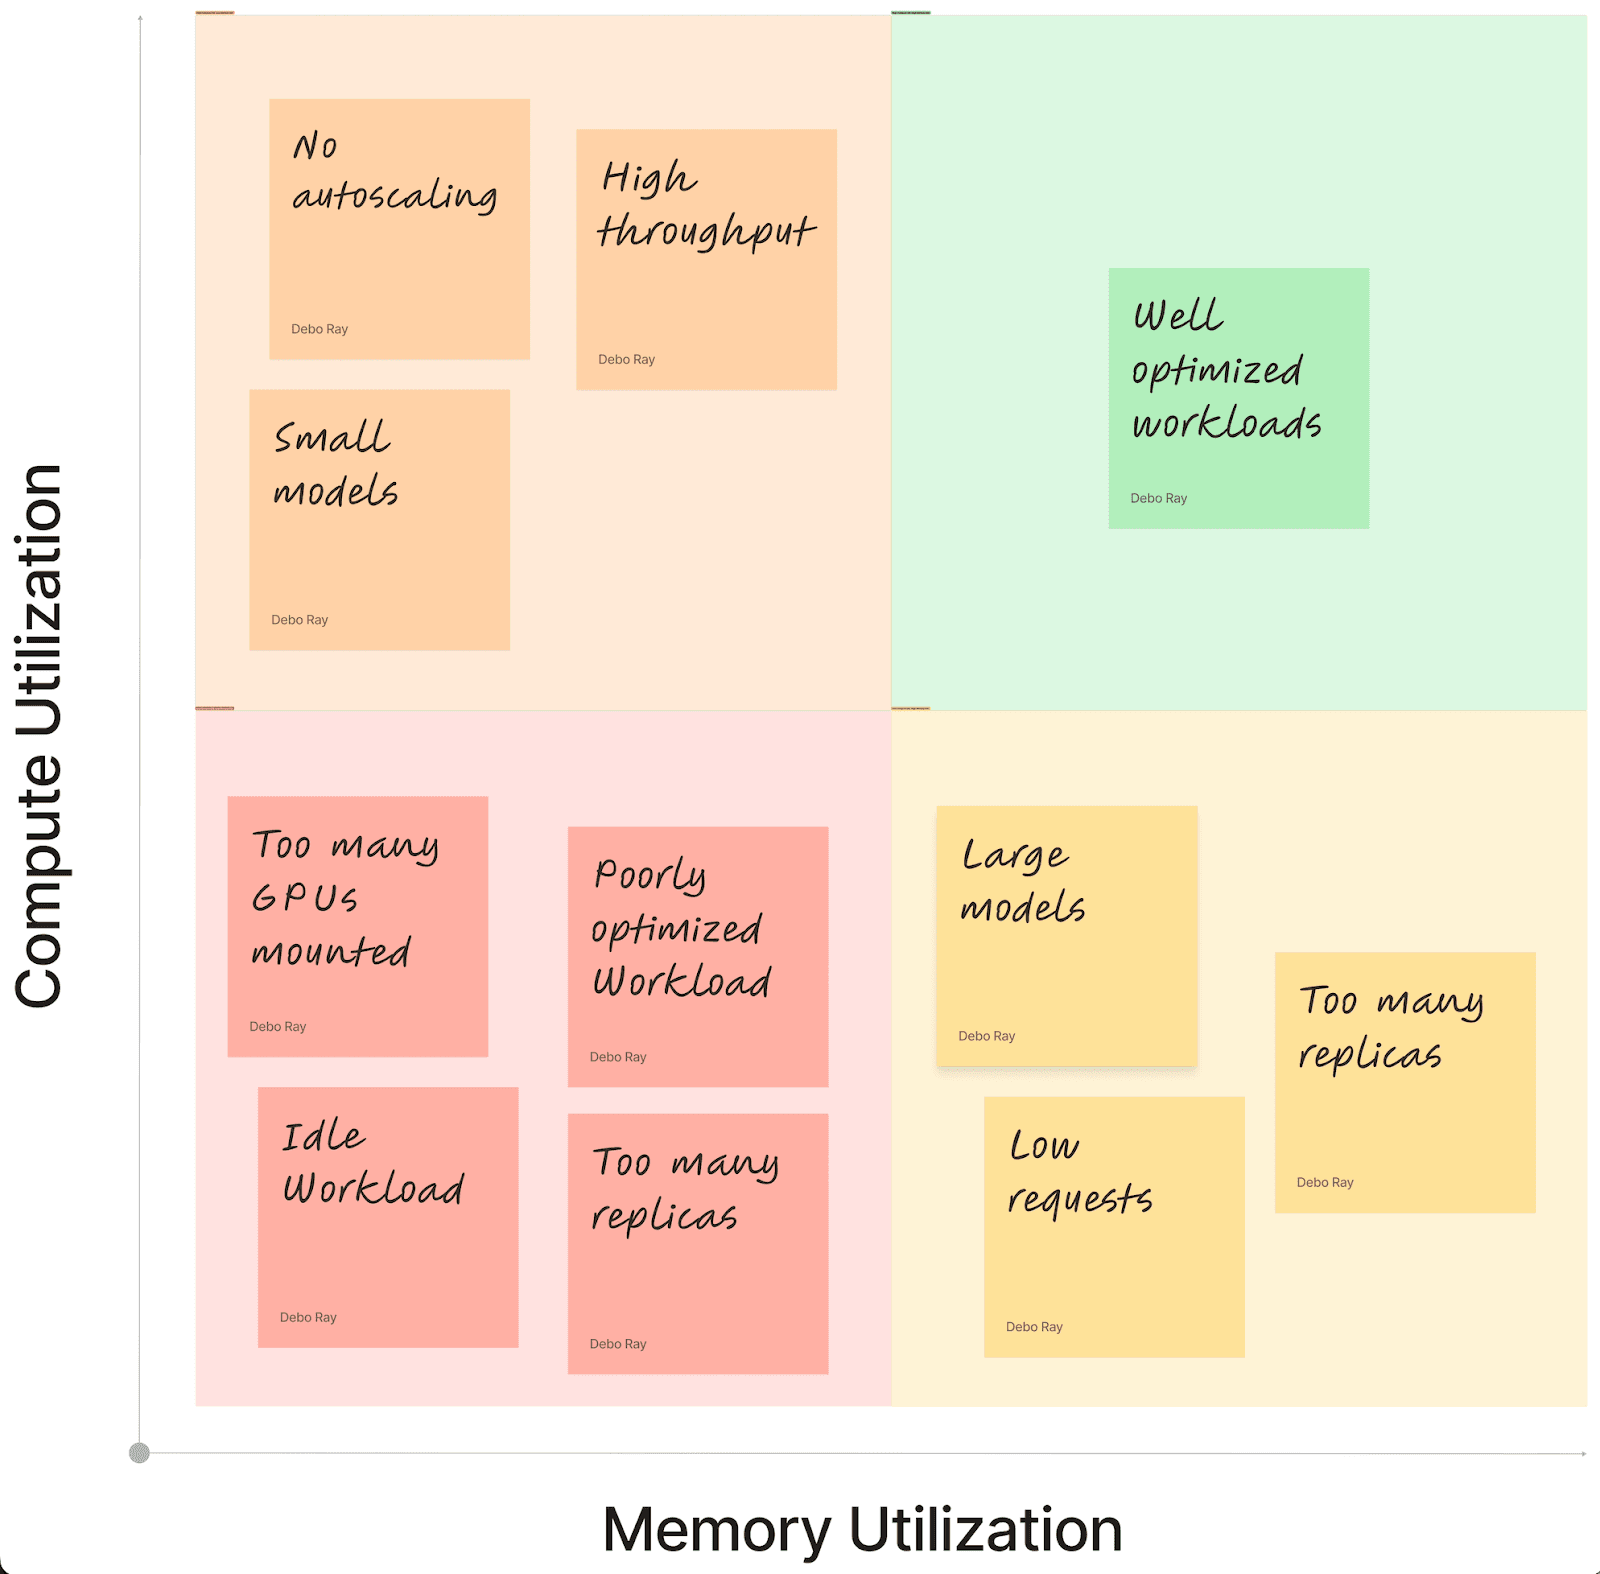
Memory vs. Compute Utilization Patterns:
- High memory, low compute: Large models with infrequent inference requests
- High compute, low memory: Small models with high request throughput
- Low memory, low compute: Idle or poorly optimized workloads
- High memory, high compute: Well-optimized workloads operating at capacity
This multi-dimensional analysis enables strategic decisions about workload placement, resource sharing opportunities, and optimization priorities.
Cluster-Wide Visibility and Trends#
Strategic GPU monitoring must extend beyond individual workloads to provide cluster-wide insights into utilization patterns, trends, and optimization opportunities. This includes:
- Utilization distribution: Which workloads and teams are driving GPU consumption
- Temporal patterns: Peak usage times and idle periods that enable better scheduling
- Cost attribution: Mapping GPU usage to specific teams, projects, or cost centers
- Optimization opportunities: Identifying underutilized resources and sharing possibilities
**Join this upcoming workshop with NVIDIA to learn more about GPU utilization for Kubernetes. **Register here.

Debo Ray
Co-Founder, CEO


